
Last updated [2025.6.10]
You may not be familiar with the concept of Core App Dashboard, but you certainly know what a dashboard is.
From car dashboards that display speed and fuel levels to fitness trackers monitoring steps and heart rates, and financial dashboards keeping track of stock and fund performance, these tools visualize real-time data to help us make data-driven decisions quickly.
In the digital age, with the explosive growth of data and increasingly complex business demands, companies are seeking real-time monitoring, analysis, and decision-making support, leading to the emergence of Core App Dashboard.
What is a Core App Dashboard?
Like the dashboards we encounter daily, a Core App Dashboard is a comprehensive monitoring and analysis tool. It integrates key information from various data sources—such as sales data, customer feedback, market trends, and internal operational efficiency—and transforms this complex data into intuitive charts and metrics. Through a Core App Dashboard, decision-makers can grasp the overall business situation at a glance, identify problems and opportunities promptly, and make data-driven decisions.
Advantages of Core App Dashboards
As an efficient data visualization tool, Core App Dashboards offer several practical benefits:
- Data Visualization: Core App Dashboards present data through charts, graphs, and metrics, making complex information intuitive and easy to understand. This visualization helps users quickly grasp key information and identify trends and issues, leading to a better understanding of business conditions.
- Real-Time Monitoring: Core App Dashboards provide real-time data monitoring, allowing users to stay updated on business performance and key metrics. This capability enables users to detect problems and take action promptly, enhancing business agility and responsiveness.
- Data Integration: Core App Dashboards can integrate multiple data sources, consolidating scattered data into a single view. Users can access a comprehensive data overview on one interface, avoiding the hassle of switching between different systems, which increases efficiency.
- Data-Driven Decision Making: With the data and analysis presented by Core App Dashboards, users can make decisions based on data, improving accuracy and efficiency while driving business growth.
- Business Optimization: By monitoring key metrics and trends, Core App Dashboards help users identify potential problems and opportunities in the business, optimizing processes, increasing efficiency, and boosting revenue.
💡 Read More: The Ultimate Guide to Data Transformation Tools
Best Core App Dashboard Building Tools
NocoBase: No-Code/Low-Code Development Platform
- Data Model Driven: NocoBase employs a data model-driven design, allowing users to flexibly define and adjust data structures and quickly connect to various data sources (like MySQL and PostgreSQL). Its visual modeling tools simplify complex data relationships while providing a variety of data table types to meet different business needs, enhancing data management and analysis capabilities.
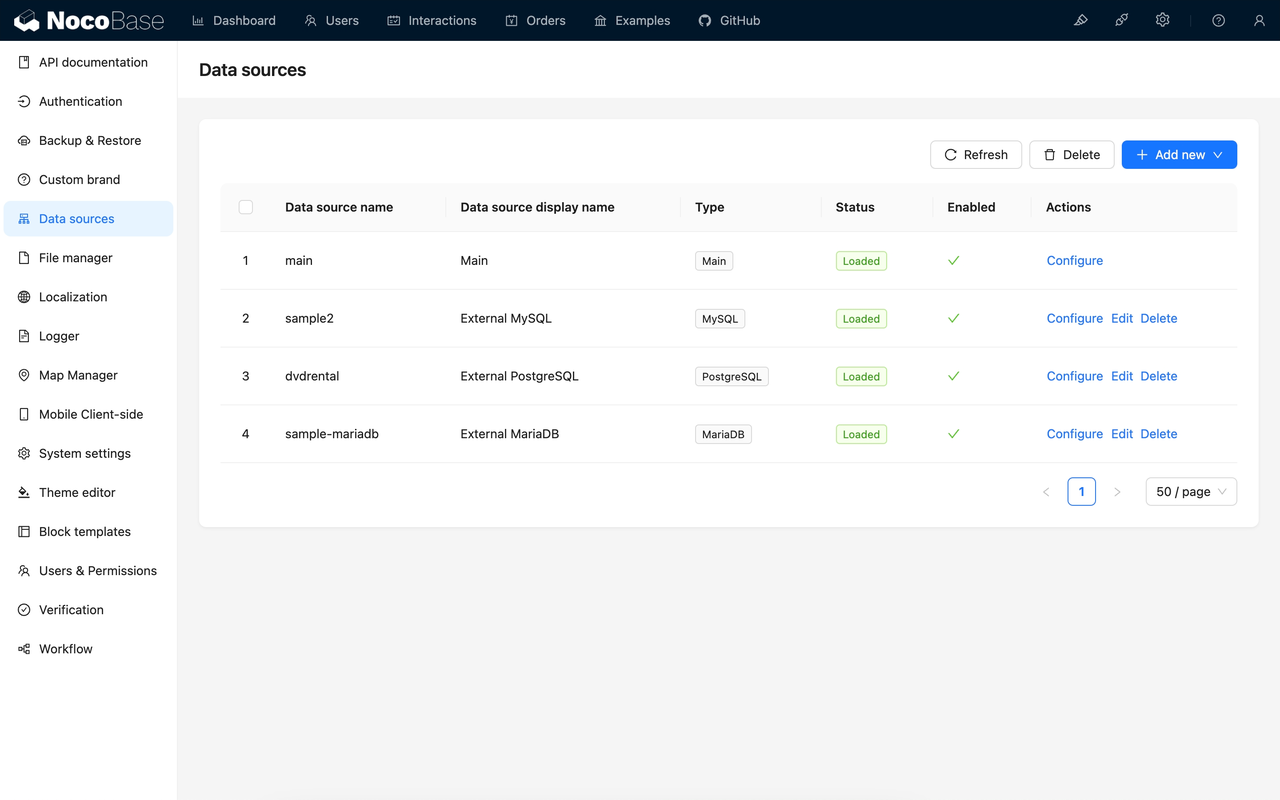
- Powerful Integration Capabilities: NocoBase supports integration with various data sources and third-party APIs, enabling businesses to easily connect existing systems and external services, ensuring data’s timeliness and consistency.
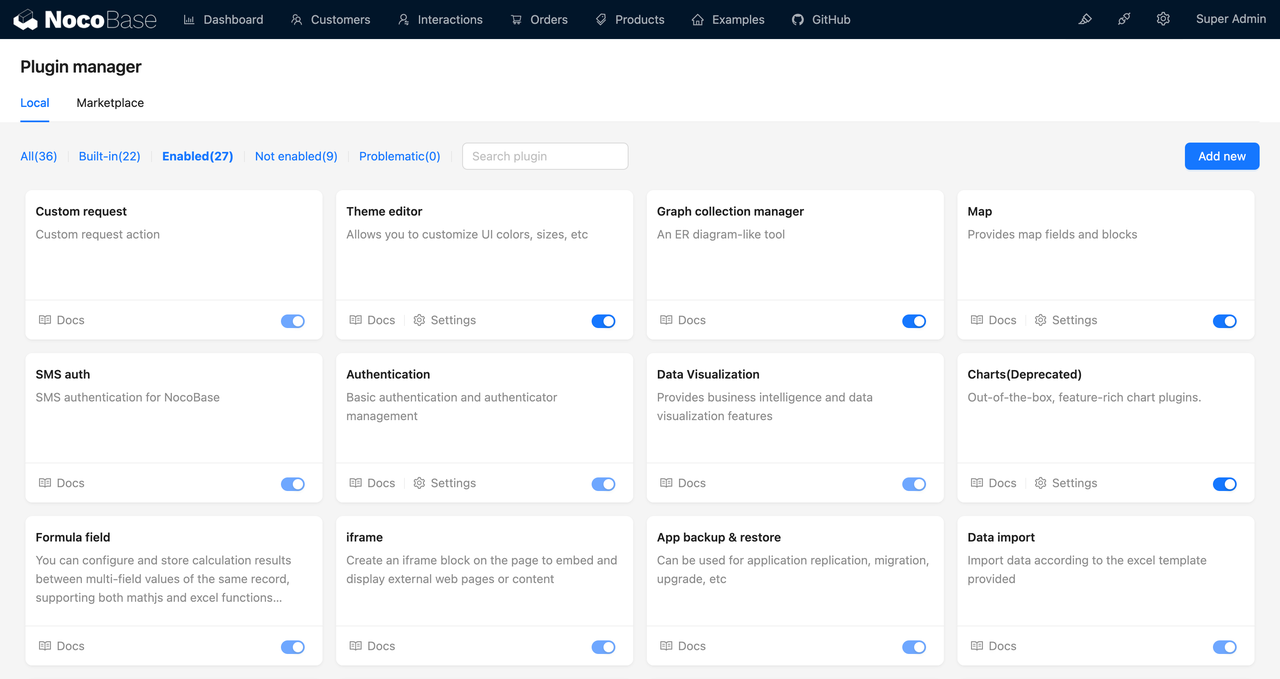
- Flexible Chart Features: NocoBase offers diverse charts and visualization tools, allowing users to select and customize different chart types according to their needs. This visualization helps businesses understand data trends and key metrics more intuitively.
- Easily Extensible Plugin Architecture: NocoBase’s microkernel architecture allows users to develop custom plugins based on specific business needs, enabling easy feature expansion without affecting existing systems.
🙌 Have a try: NocoBase Tutorial – Task Management System
Tableau: Business Intelligence and Analytics Software
- Data Visualization: Tableau focuses on data visualization, providing a rich variety of chart types and interactive features, allowing users to create dynamic dashboards easily. Its intuitive drag-and-drop interface enables even non-technical users to get up to speed quickly.
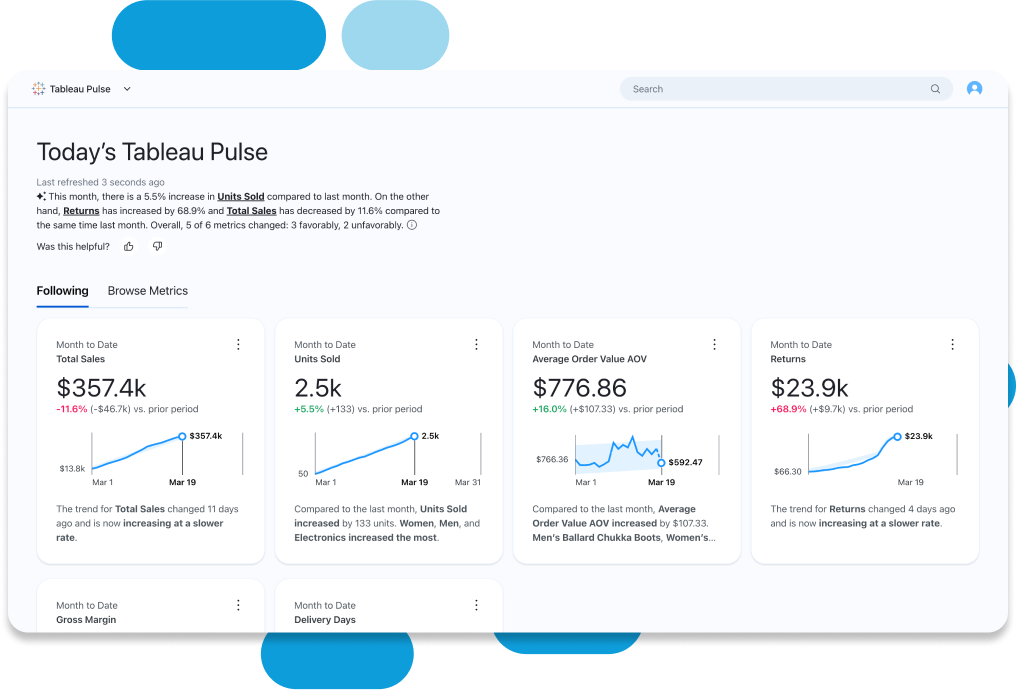
- Real-Time Analysis: Tableau offers powerful analytical tools, allowing users to explore data deeply and uncover potential business insights through calculated fields, parameters, and filters.
- Collaboration and Sharing: With Tableau, users can discover, share, collaborate on, and explore data on mobile devices, tablets, or computers, effectively driving team collaboration.
Power BI: Data Visualization Tool
- Powerful Data Connectivity: Power BI supports connections to various data sources, including Excel, SQL Server, and cloud services (like Azure and Salesforce), allowing users to easily import and integrate data for fast decision-making.
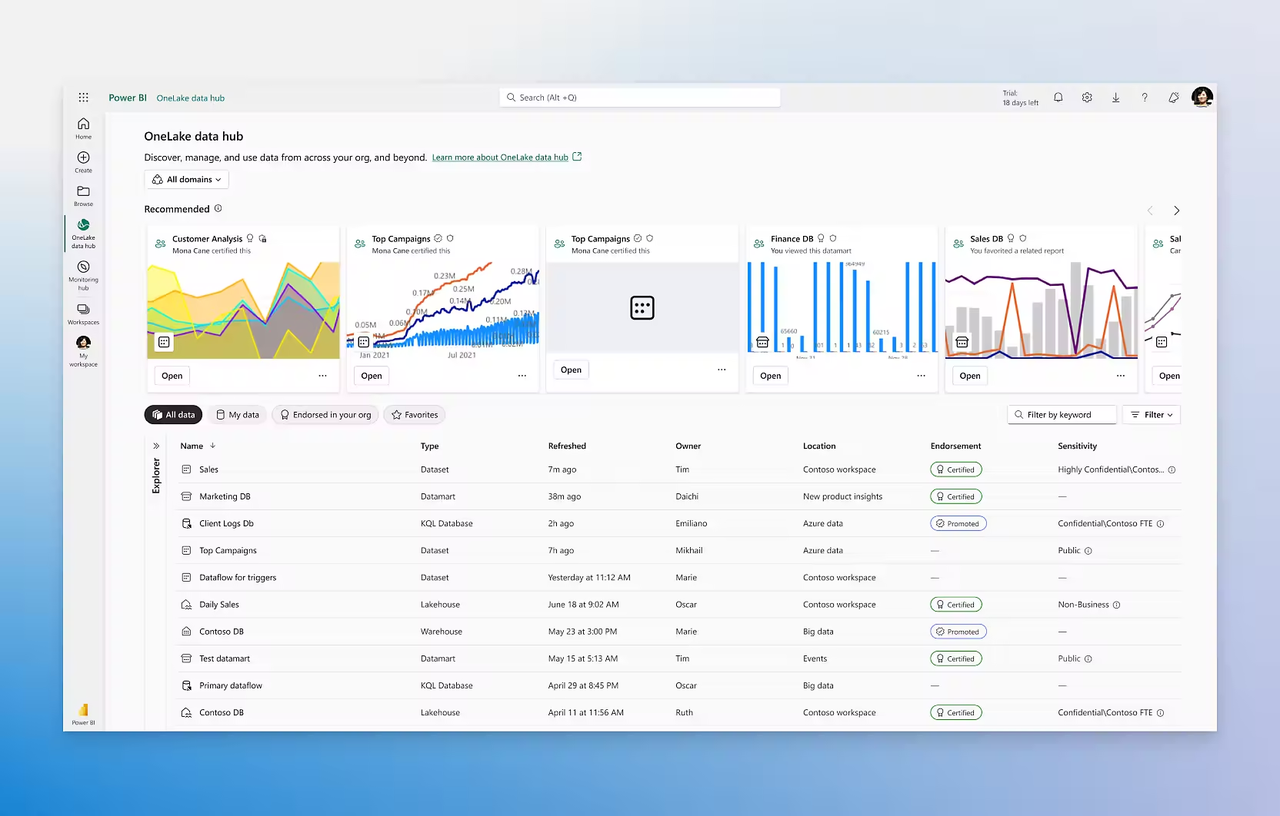
- Rich Visualization Options: Power BI provides multiple visualization tools, enabling users to create charts, maps, and dashboards to intuitively present data analysis results.
- Intelligent Analysis Features: Power BI integrates AI technologies, allowing users to leverage natural language queries and intelligent data modeling for quick insights.
Looker: Personalized Data Dashboard Tool
- Embedded Analytics: Looker’s powerful embedded capabilities turn data into deeply integrated, value-driven experiences, allowing fully interactive information centers to be seamlessly integrated into applications.
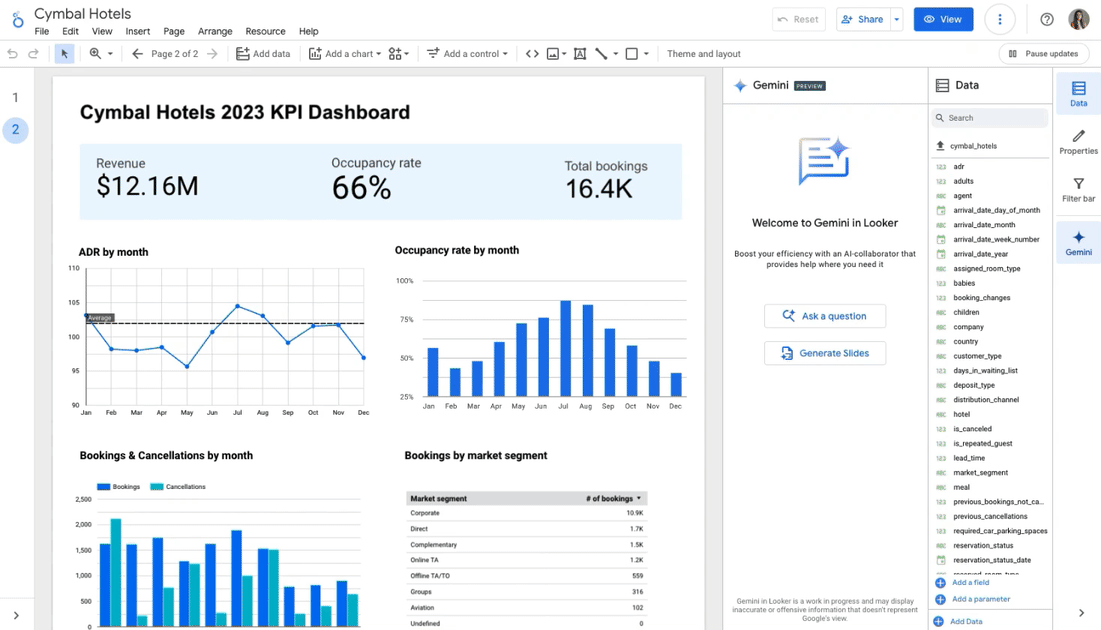
- Interactive Dashboards: Looker provides highly interactive dashboards, enabling users to explore data through clicks and filters, with real-time updates to view the latest changes and trends.
- Cloud-Native Platform: As a cloud-native platform, Looker supports large-scale data processing and storage, allowing businesses to remain competitive without worrying about infrastructure maintenance.
Domo: Business Intelligence Analysis Tool
- Integration and Data Connectivity: Domo seamlessly integrates with hundreds of data sources, including databases, cloud services, social media, and spreadsheets, allowing users to quickly consolidate various data sources into one platform.
- Dynamic Dashboards: Domo provides a user-friendly interface for creating dynamic dashboards that update in real-time, enabling users to monitor key metrics and performance.
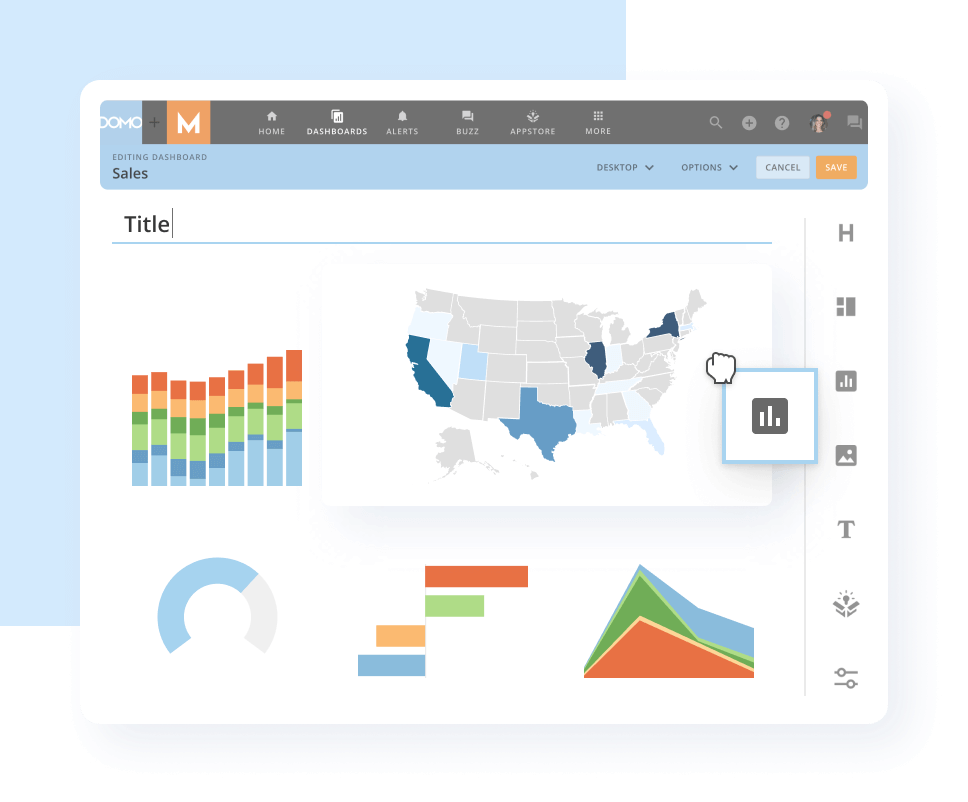
- AI and Machine Learning: Domo combines AI and machine learning features to provide intelligent insights and predictive analytics.
Grafana: Query, Visualization, Monitoring Platform
- Highly Customizable Dashboards: Grafana offers rich visualization options, enabling users to create custom dashboards with a simple drag-and-drop interface.
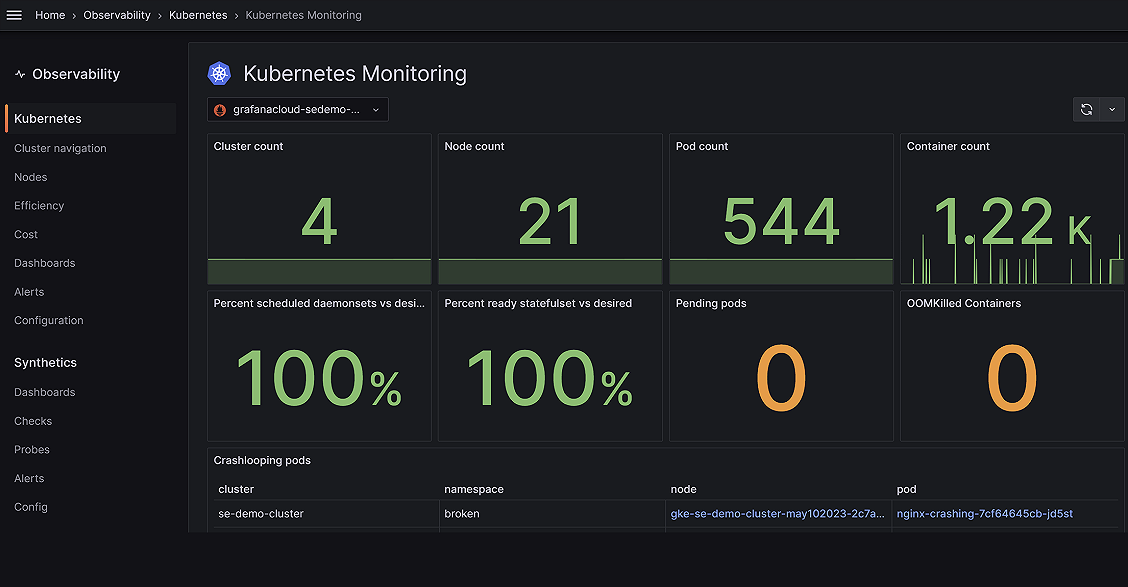
- Real-Time Monitoring and Alerts: Grafana is particularly suited for real-time data monitoring, allowing users to set alert rules to notify relevant personnel when metrics exceed thresholds.
- Plugin Ecosystem: Grafana has a rich plugin ecosystem that allows users to extend functionalities by installing new chart types, data sources, and application integrations.
Quickly Build a Core App Dashboard with NocoBase
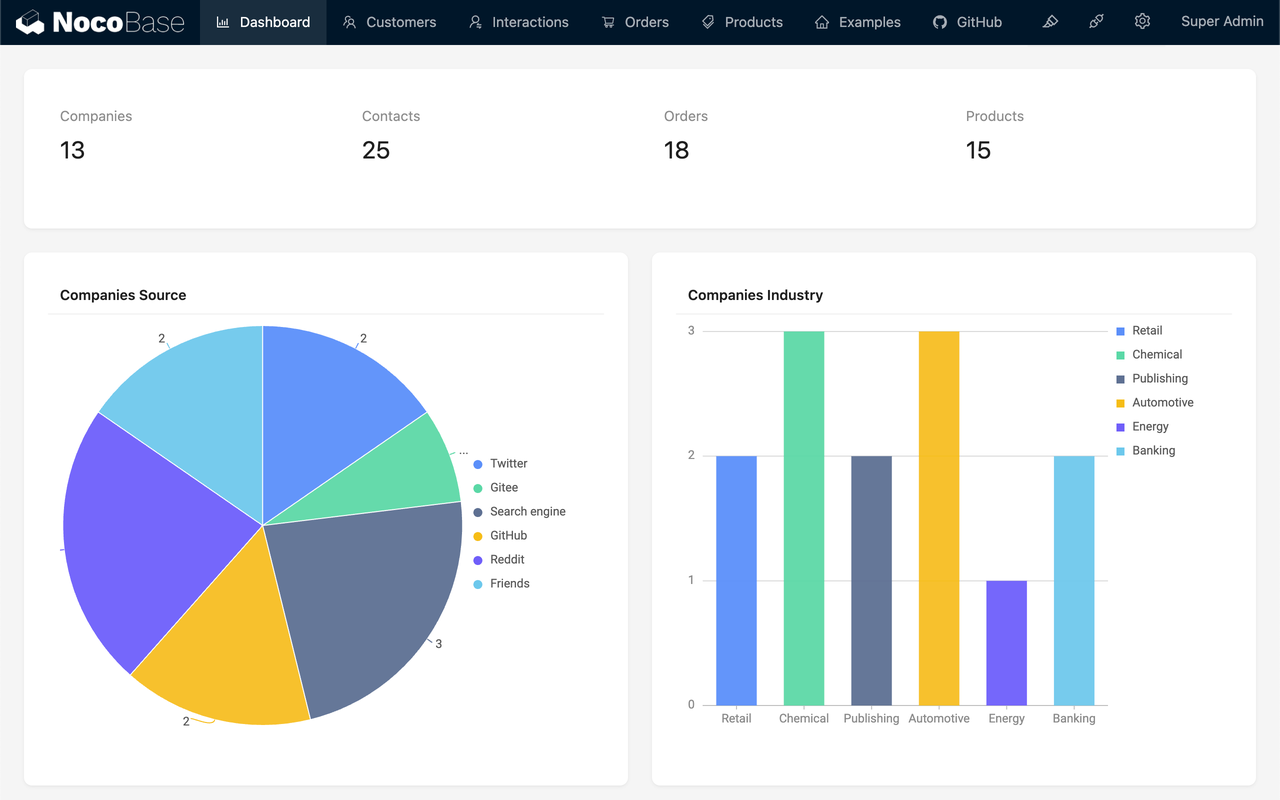
Using NocoBase to build a Core App Dashboard is both simple and efficient. Here are the basic steps to create a CRM dashboard:
- Create Collections and Fields: Start by creating data tables related to your business, such as customer and order data tables, and define the corresponding fields.
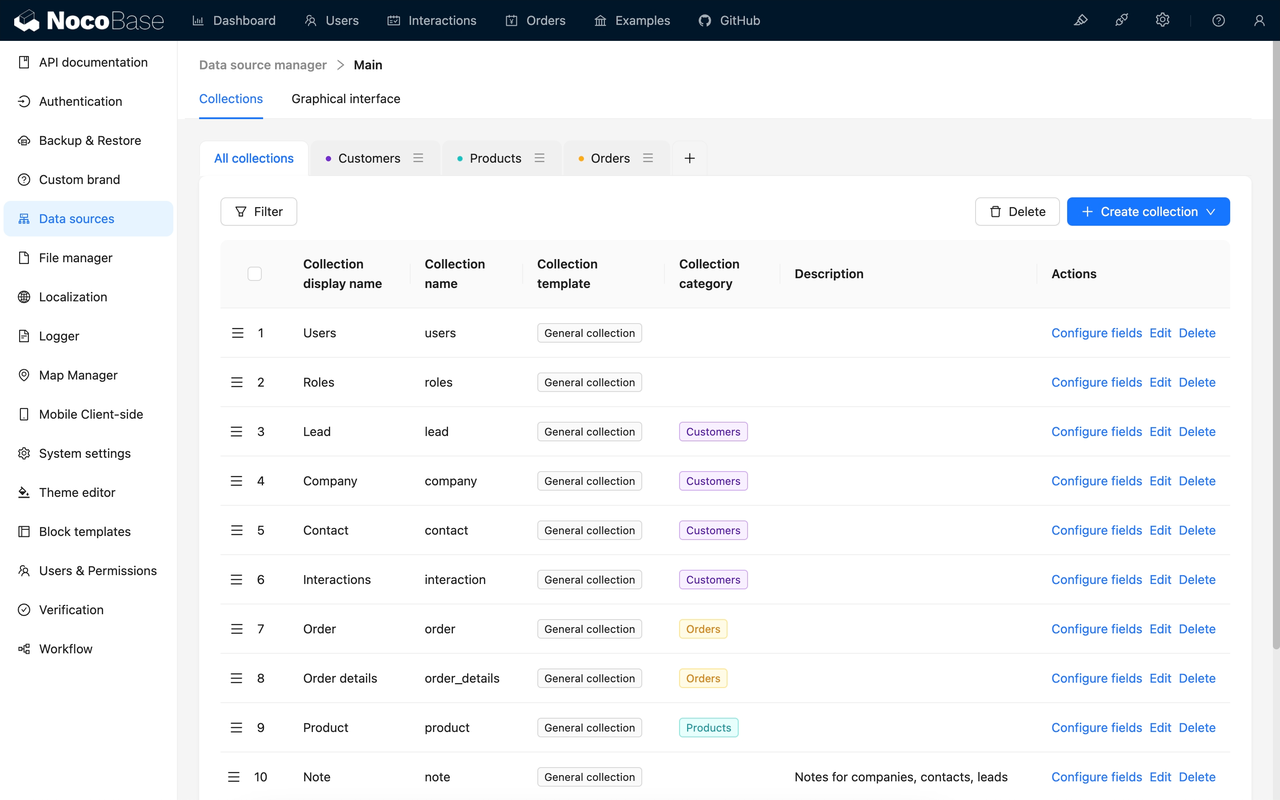
- Configure Menus and Pages: Design the layout of the dashboard according to business needs, configuring menu and page structures for easy navigation and information retrieval.
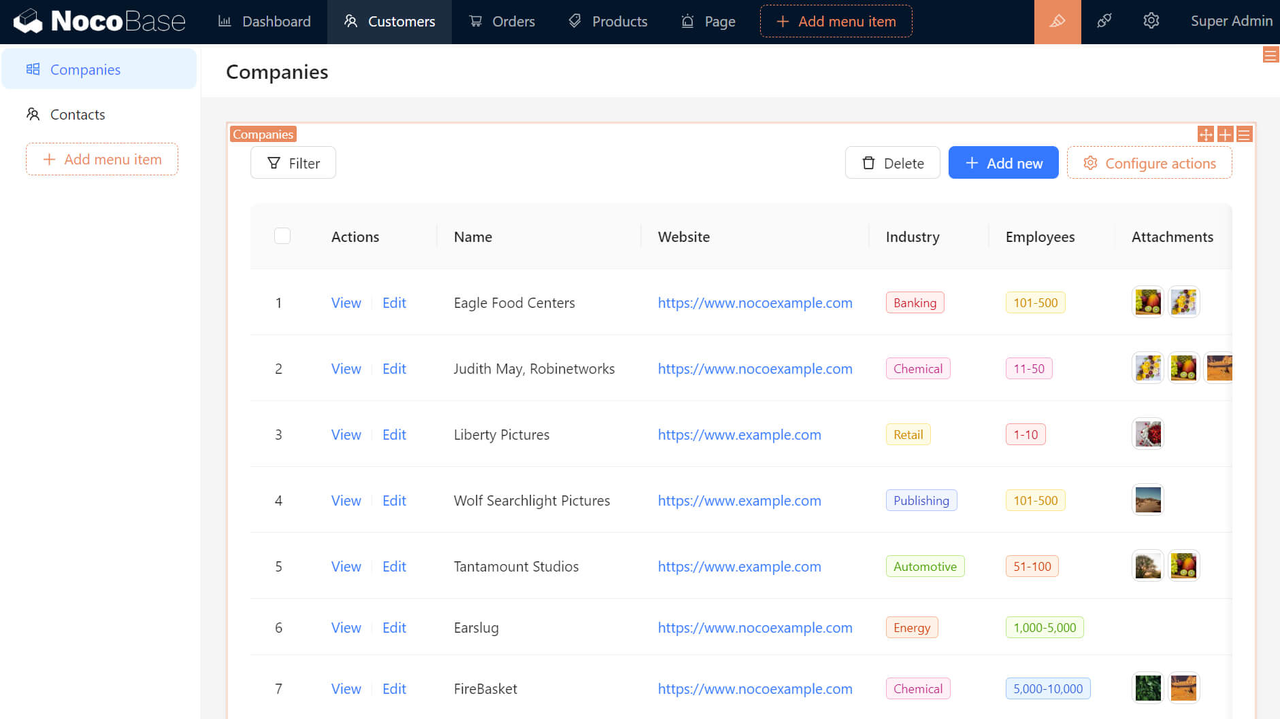
- Arrange Blocks and Actions: Add various charts, metrics, and operational blocks to the dashboard, utilizing flexible chart features to display key data and trends.
Through these simple steps, businesses can quickly establish a CRM dashboard for real-time monitoring and data analysis, supporting business development.
Online Demo:https://demo.nocobase.com/new
Related reading:
- Top 7 Open Source Alternatives to Airtable with the Most GitHub Stars
- Top 13 Self-Hosted Projects with the Most GitHub Stars
- Top 8 Open-Source CRUD Projects with the Most GitHub Stars
- Best Open-Source Tools for BPM
- 5 Best Open-Source No-Code Tools for Project Management
- Build CRM in Hours: Top No-Code/Low-Code Tools You Need to Know